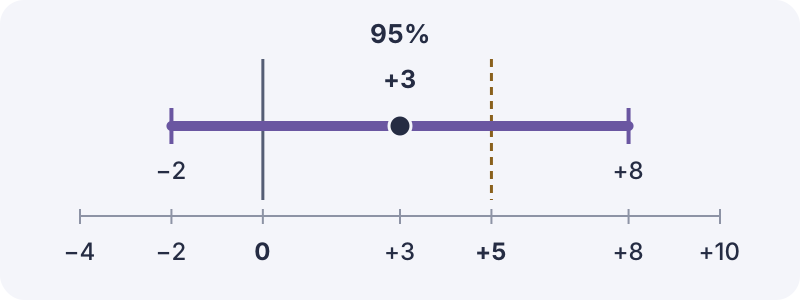
All values invented; A minus B for the same abstinence endpoint. The dot is the estimate, the violet segment the supplied interval, zero no difference and +5 a fictional preselected importance marker. It is not a probability distribution or evidence of a real effect.
- +3
Given estimate; not a certain effect or personal chance.
- −2 … +8
Supplied range includes both zero and the fictional marker.
- 0 / +5
No difference and planning importance are separate references.
Before reading the line, find its units and direction
For a difference between proportions, no difference is zero and the unit is percentage points. For a risk ratio or odds ratio, the no-difference value is one. Identify the outcome and which group is subtracted or divided by which: a positive difference in an abstinence endpoint has a different meaning from a positive difference in a smoking endpoint.
Keep the point estimate and both limits on the same stated scale. A point estimate is not necessarily the arithmetic midpoint of its interval, especially after a ratio-scale transformation. Do not turn a range into one certain number, or compare widths across unlike scales.
One invented result has two different reference marks
Everything here is fictional, not evidence for a real intervention. Imagine a report of two offers A and B, assessing no cigarette smoking during the preceding seven days at six months. It supplies A-minus-B = +3 percentage points and a 95% confidence interval from −2 to +8. We supply no raw counts, standard error or calculation that generated this interval; it is a given teaching example.
Separately, the invented protocol had selected +5 percentage points before seeing results as a group-planning importance marker. That marker is not a clinical or universal cutoff, and does not select care. The solid zero line marks equal group proportions; the dashed +5 line marks that separate fictional question.
The reported range includes a negative difference, zero and values at or above +5. The point estimate +3 is below the marker, but the supplied interval does not settle that the group difference is zero or that it falls short of the marker. Nor does the range establish a worthwhile effect. In this exercise, +3 means three percentage points, not a 3% relative increase.
A faithful summary is: ‘The fictional estimate is +3 percentage points, with a supplied interval of −2 to +8. This range leaves both no difference and the protocol's invented +5 marker compatible with the report's assumed analysis.’ It is not a treatment recommendation, a probability for either possibility or an estimate of a reader's future.
The 95% belongs to repeated procedures, not this one person's future
In the conventional frequentist interpretation, repeating the study's sampling and interval procedure under its valid assumptions would produce intervals covering the fixed target parameter at the stated long-run rate. Different samples give different intervals. This is not a promise that exactly 95 of any particular 100 repetitions will cover it, or a posterior probability for the interval already reported.
A Bayesian credible interval is different: its probability interpretation depends on a specified model and prior distribution. Check whether the report says confidence interval (CI) or credible interval (CrI); a shared ‘95%’ does not make them interchangeable. Neither label alone forecasts an individual's quitting outcome.
Neither narrowness nor a boundary supplies certainty
Width on the appropriate scale describes precision, not freedom from bias. Available information, event counts and the method matter; participant totals alone cannot certify precision. Ordinary intervals do not automatically quantify all errors from missing data, measurement, confounding or selective reporting. A narrow interval can accompany a misleading estimate.
Values inside an interval are not all equally supported. Values just outside are not proven impossible, and a tiny change across an endpoint should not reverse the whole story. Model assumptions and the chosen confidence level contribute to where the endpoints lie. A reported interval also does not promise to contain 95% of future studies' point estimates.
Bring the range back to the actual research question
In a real report, retain the outcome, assessment time, population, comparison, estimate, units and both interval limits. Read how the analysis handles missing data and whether the result was prespecified. Locate the justification for any importance threshold rather than inventing one after seeing the result.
Write what magnitudes remain uncertain and which assumptions support that reading. A confidence interval cannot replace an assessment of bias or applicability. No individual records, smoking history or online personal-risk calculation are needed to interpret a published group interval.
For personal questions, use an appropriate support route
NHS Better Health links people in England to local Stop Smoking Services. A qualified professional can discuss your own support needs; confirm current arrangements where you live. A study's interval is not a personal success score.
What to keep in mind
Sources
The central claims on this page were checked against the sources below.
- Cochrane: Cochrane Handbook chapter 15, §15.3.1 — confidence intervals and meaningful magnitude
Sources checked: 2026-10-04
- European Journal of Epidemiology: Greenland et al., 2016 — confidence-interval misinterpretations and model assumptions
Sources checked: 2026-10-04
- NHS Better Health: Ready to quit smoking — local professional support
Sources checked: 2026-10-04
General statistical literacy, not personal prognosis, a smoking-status judgment or treatment choice. All illustrated estimates and the importance marker are invented. No personal inputs, storage or transmission.